


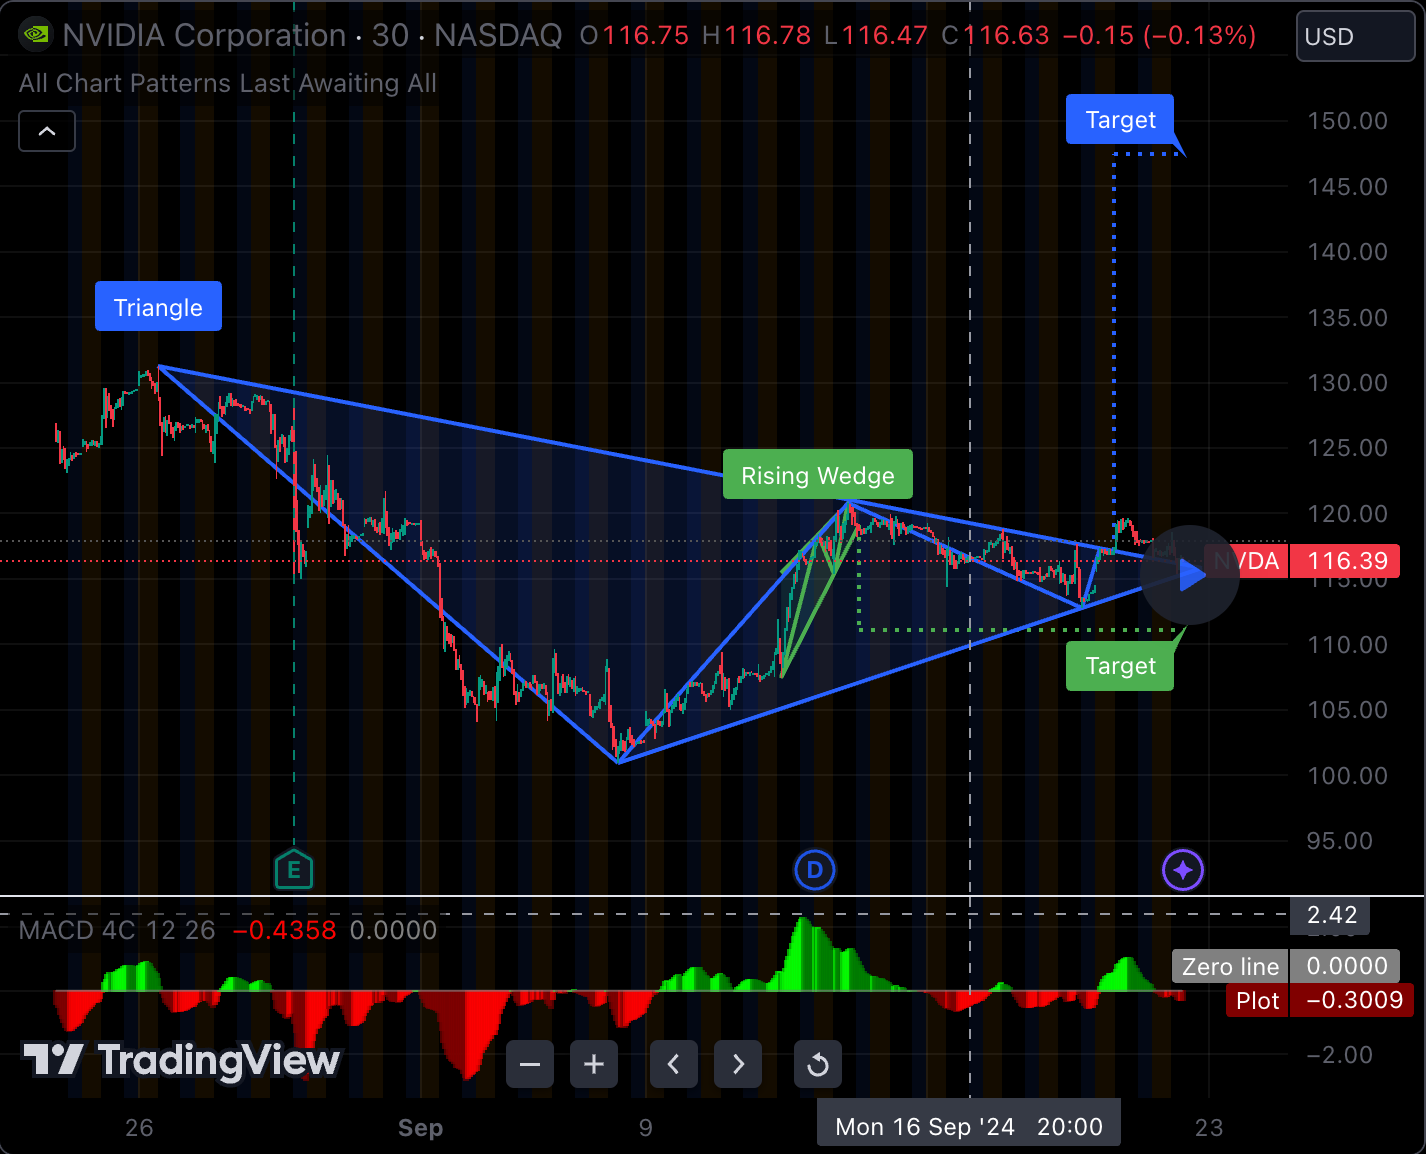
NVDA is currently exhibiting an ascending triangle pattern—a bullish signal—visible on the 1-hour, 4-hour, daily, and extended to the 1-month and 3-month charts. The Commodity Channel Index (CCI) does not indicate overbought conditions on these timeframes, and the MACD signal remains above the MACD line on both the 4-hour and daily charts, supporting a positive outlook.
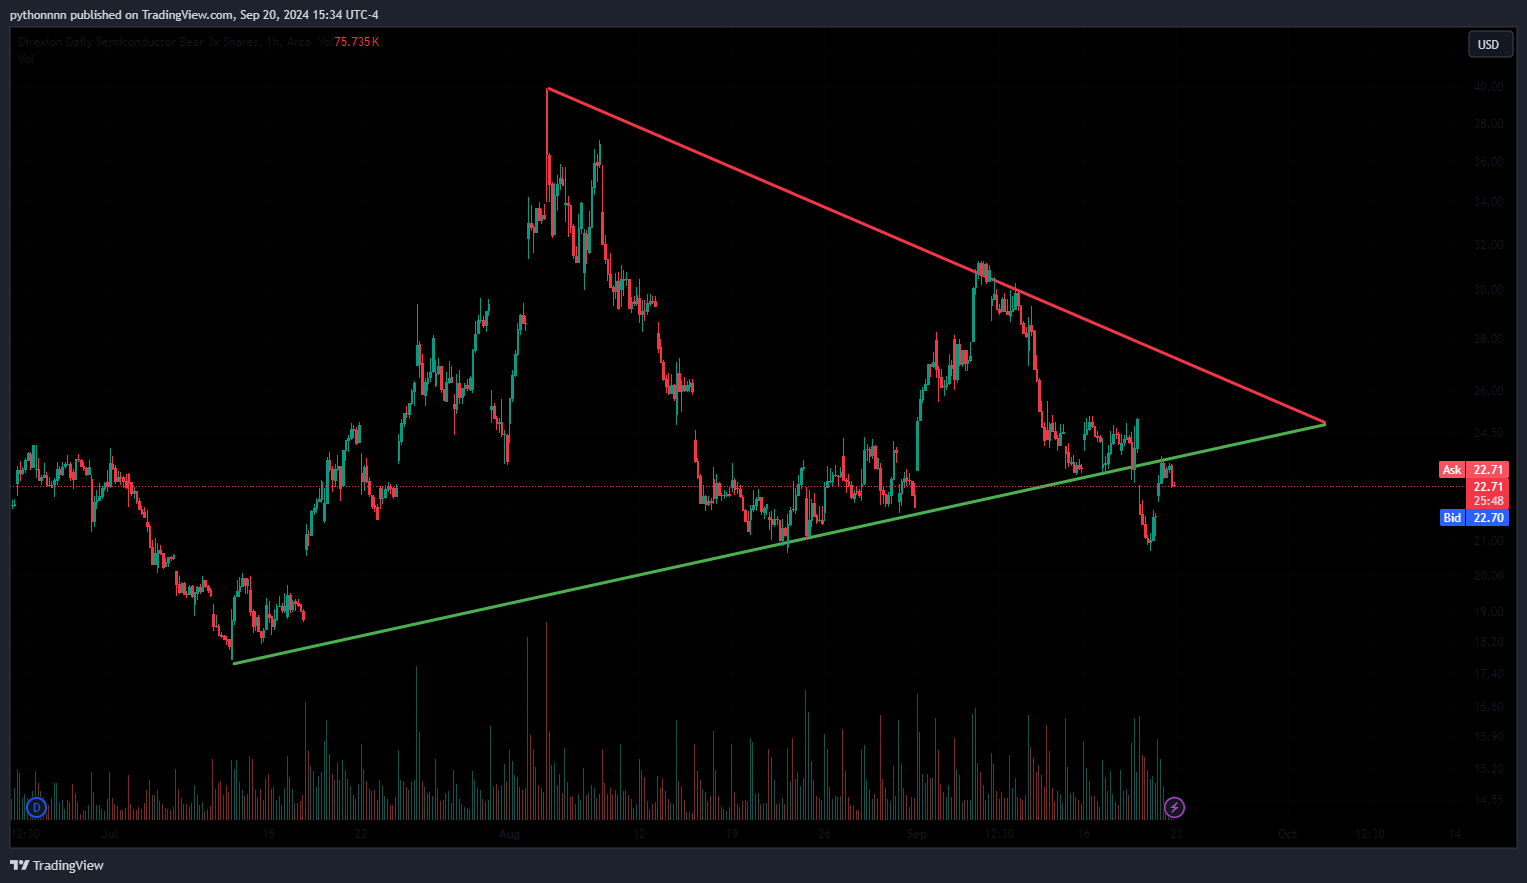
SOXS has recently broken downward and retested its support-turned-resistance level, which further suggests bullish momentum for NVDA. This technical setup indicates a potential move towards all-time highs (ATH).
Based on this analysis, NVDA may reach $125. It could either consolidate and break out upwards to new ATHs or hit $125 and retrace to the major support zone between $105 and $110. Please remember that this is a speculative assessment and not financial advice. Always conduct your own research before making investment decisions.